1 Introduction
Since natural lighting can reduce the energy consumption of building lighting, natural lighting simulation technology has been rapidly developed since the energy crisis in the 1970s, and lighting methods such as side window lighting, atrium lighting, and skylighting have gradually been adopted by architects.
Commonly used lighting simulation software includes ADELINE in Germany, SUPERLITE and Radiance developed by Lawrence Berkeley Laboratories, and Daysim developed by Canadian Construction Research Institute. In addition, many scholars have also studied the factors affecting the lighting effects of side windows and atrium, and summarized the empirical formulas for design and calculation.
Although the detailed time-by-time simulation software can calculate the lighting coefficient and the annual lighting compliance rate of various lighting components, the modeling is complicated and the calculation time is long, and it is difficult to quickly analyze the building scheme. Although the existing empirical formula is fast and easy to operate, at present, only the lighting coefficient can be calculated, and the annual lighting acceptance rate cannot be calculated, and the lighting energy saving rate cannot be predicted. In addition, both the time-by-time simulation software and the empirical formula can only calculate the lighting effect of a single lighting component, and it does not reflect the natural lighting effect of the building as a whole, nor can it analyze the influence of architectural modeling, layout, and façade design.
In order to improve the lighting level of the architectural scheme and enable the natural lighting technology to be integrated into the scheme concept, it is necessary to study the simple and fast natural lighting performance analysis method and design flow based on the existing lighting simulation software.
2 simulation software
Daysim is a simulation calculation software developed by the Canadian Institute of Construction to predict the natural daylighting performance of a building. The software is based on the Radiance calculation core and uses DA as an indicator of natural lighting throughout the year. The software error is less than 10%, which is more accurate than similar software.
The specific settings for the daylighting simulation calculation using Daysim software are as follows:
(1) The location is Beijing, and the meteorological parameters of the DeST energy simulation software are selected for the meteorological parameters;
(2) The indoor lighting period is 7: 00 ~ 20: 00;
(3) The allowable illumination value of office buildings is 300 lx;
(4) By default, the sunshade louver is placed. When the direct sunlight irradiance of the working surface exceeds 50 W/m2, the sunshade louver is lowered, and the visible light transmittance of the louver is 25%.
5; The reflectance of the floor is 0. 4;
(6) Lighting control methods include on-off control (calculation DA) and continuous dimming control (calculation DAcon).
3 side window lighting analysis
The factors affecting the lighting performance of the side windows of the building include the window-to-wall ratio, the height of the window sill, the visible light transmittance of the glass, the reflectance of the surface of the indoor wall, the orientation, the setting of the sunshade and the louver. The plan phase mainly studies the window-to-wall ratio and the visible light transmittance of the glass. And the effect of the orientation on the lighting performance. The farther away from the side window, the smaller the effect of daylighting, the impact range is about 3. 7 meters, this article considers 4 meters.

As shown in Figure 1, the room has a depth of 10 meters, a floor height of 4 meters, and an indoor working plane height of 750mm. The detailed simulation calculation is carried out for the case of different window-to-wall ratio (0.3 ≤ ω ≤ 0.7) and different glass visible light transmittance τ (0.4 ≤ τ ≤ 0.8), and the regression analysis is carried out as follows. Show empirical calculation formula.
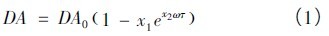
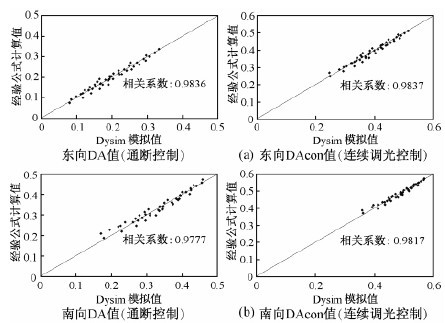
Among them, DA0 is the proportion of time that the outdoor illuminance meets the indoor illuminance requirement during the working time period, and the coefficients of x1 and x2 are shown in Table 1. The correlation analysis between the fitting calculation formula and the simulation calculation results is shown in Fig. 2. The correlation between the two is large, and the fitting formula can reflect the relationship of the actual glazing performance with the (ωτ) value.

4 Atrium lighting analysis
There are many factors affecting the lighting performance of the atrium, including the atrium form (light well index WI), the atrium wall opening area, the skylight opening area, the visible light transmittance of the skylight glass, the skylight form, the atrium bottom reflection ratio, and the atrium inner wall average reflectance. . The design stage is mainly concerned with the influence of the atrium form, the skylight opening area, the visible light transmittance of the glass, the skylight form, and the opening area of ​​the surrounding area on the lighting of the building interior space and the envelope structure parameters.
4. 1 Atrium bottom lighting
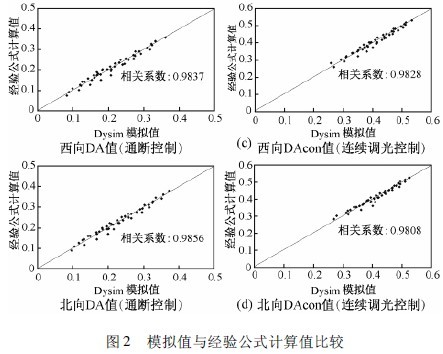
The roof visible light equivalent transmittance Ï„roof (the product of the skylight visible light transmittance and the roof skylight area ratio) and the light well index WI have a greater influence on the atrium bottom lighting. For the case of a building with a height of 4 m, a 6-story building, a 20-meter atrium and a width of 20 m, a flat-open window at the top, and a visible light transmittance of 0.6 in the glass, calculate the DA variation of different WI and Ï„roof values. The law is shown in Figures 3 and 4.
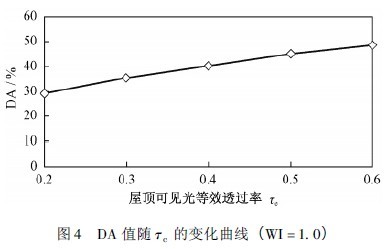
As the WI value increases, the DA value decreases, and the decreasing trend is divided into two different phases. When the WI value is less than 1.5, the DA begins to decrease slowly, and then decreases rapidly; when the WI value is greater than 1.5, DA The downward trend is slower and faster; as the Ï„roof increases, the DA increases negatively.
According to the characteristics of DA variation, the piecewise function is used for fitting. When WI is less than 1.5, it can be calculated by formula (2); when WI is greater than 1.5, it can be calculated by formula (3).
Select a combination of different WI (0. 2 ≤ WI ≤ 3. 2) and τroof (0. 2 ≤ τroof ≤ 0. 6) values, and perform regression analysis according to equations (2) and (3) to obtain the results as shown in Table 2. The values ​​of the coefficients x1 to x6 are shown. The correlation analysis results are shown in Figure 5. The correlation coefficients are 0.9965 and 0.9951, respectively. The correlation is high. The fitting formula can reflect the lighting effect of the bottom of the atrium.

